What is Retail Positioning?
Retail positioning data (often called "Sentiment") shows us what the average home trader is doing. Are they buying EUR/USD? Are they selling Gold?
Retail Sentiment Index (RSI)
A ratio showing the percentage of retail traders who are Long vs Short a specific asset.
Example: 80% Long / 20% Short
This data usually comes from large retail brokers (like IG, OANDA, or FXCM) who publish their clients' aggregate positions. At Fundabias, we aggregate multiple sources to give you the "Global Retail View".
The Psychology of the Crowd: Why They Lose
To use this data, you must understand WHY the crowd is wrong. It comes down to one fatal flaw:
The "Reversion to Mean" Fallacy
Retail traders love to fade trends. They hate buying high and selling higher. They want to buy low and sell high.
Price Rallies: EUR/USD goes up 100 pips.
Retail Sells: "It's gone up too much, it must come down."
Price Rallies More: EUR/USD goes up another 100 pips.
Retail Adds to Shorts: "Now it's REALLY overbought. Averaging down."
The Blowout: Price explodes higher. Retail accounts targeted. Margin calls.
When retail positioning hits extremes (e.g., >70% Long), it is a powerful signal that the trend will CONTINUE in the opposite direction.
How to Trade It (Contrarian Strategy)
So, if the crowd is wrong at extremes, how do we profit? We do the opposite.
Retail is Extreme Long (>70%)
The Signal: Everyone has already bought. There is no one left to buy. The only direction is down.
Retail is Extreme Short (>70%)
The Signal: Everyone is betting on a crash. The market is oversold. A short squeeze is imminent.
Warning: Extremes Only
If sentiment is 55% Long vs 45% Short, ignore it. That's noise. The edge only exists at extremes (above 65-70%).
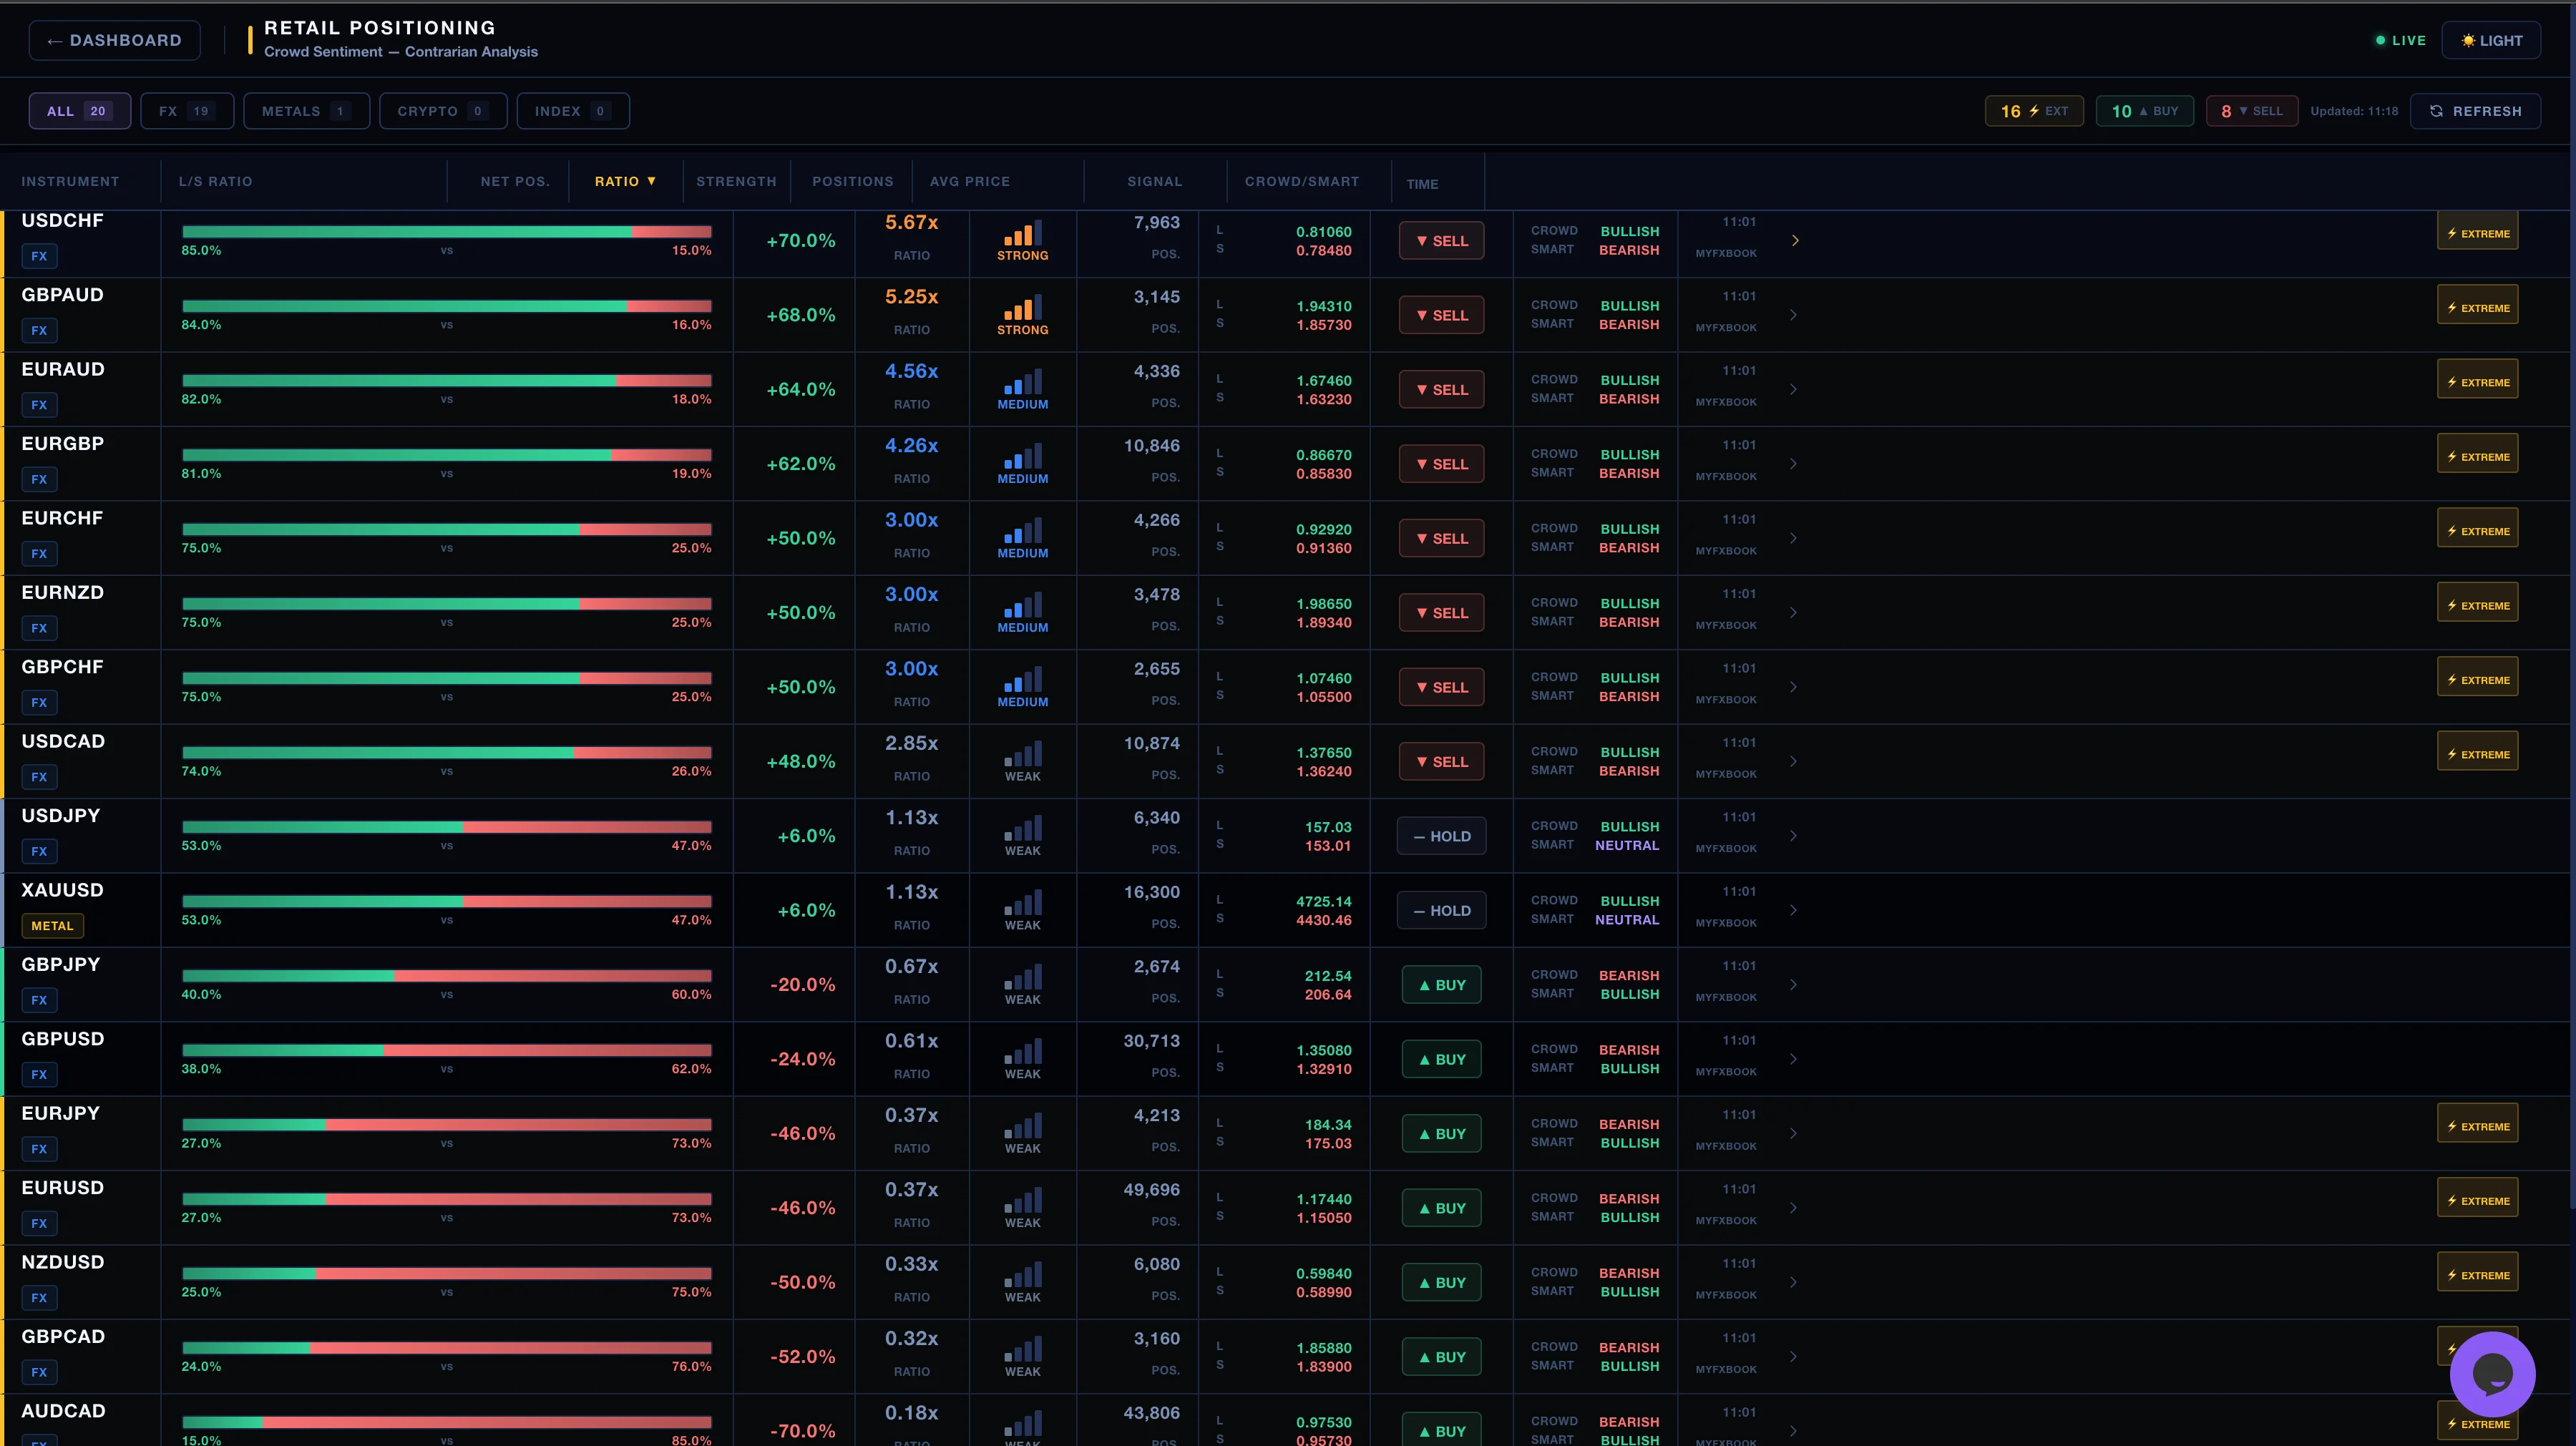
Visualizing Sentiment
Here is what the Retail Sentiment widget looks like in the Fundabias Dashboard. We aggregate data from multiple brokers to give you the true picture.
Real-World Examples
The GBP/USD Crash (2022)
In September 2022, GBP/USD was crashing towards parity. Retail traders kept buying the dip.
- Retail Sentiment: Reached 85% LONG.
- Price Action: Continued to crash another 500 pips.
- Outcome: Retail blew accounts trying to catch a falling knife. Contrarians rode the trend down.
The Gold Rally (2023)
Gold broke $2000. Retail traders thought it was "too high" and started shorting.
- Retail Sentiment: Reached 75% SHORT.
- Price Action: Gold rallied to $2150 (All-time highs).
- Outcome: A classic short squeeze fueled by retail stop-losses.
Conclusion
Retail positioning is one of the few true "leading indicators" available to traders. It tells you where the pain is. And in markets, price always moves towards maximum pain.
Don't be part of the 95%. Be part of the 5% who profit from them.
Ready to Trade Against the Crowd?
Get real-time sentiment data for 50+ pairs on your dashboard.